 Products Home / Optical Elements / Nonlinear Crystals / PPKTP Crystals for Spontaneous Parametric Down Conversion (SPDC)
PPKTP Crystals for Spontaneous Parametric Down Conversion (SPDC)

- Periodically Poled Potassium Titanyl Phosphate (PPKTP) Nonlinear Crystals Optimized for Type-0 or Type-II Spontaneous Parametric Down Conversion
- Drop-In Compatibility with Nonlinear Crystal Ovens
- Source for Polarization Entangled Photons or Heralded Single Photons from 405 nm or 775 nm Pump Lasers
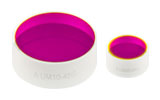
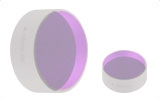
NLCK1
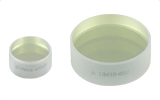
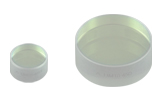
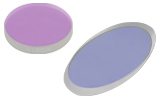
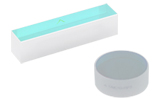
Mounted PPKTP Crystal, Type-0 SPDC, 405/810 nm
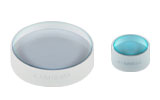
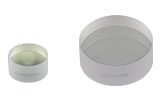
NLCK4
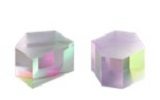
Mounted PPKTP Crystal, Type-II SPDC, 775/1550 nm
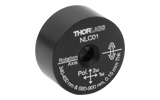
NLCH2
Oven for Nonlinear
Crystals up to 30 mm Long
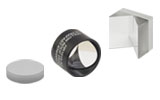
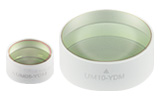
An NLCK1
SPDC crystal is
mounted in an NLCH2 oven to
adjust its temperature for tuning.


Please Wait
| Key Common Specificationsa | |
|---|---|
| Material | PPKTP (Periodically Poled Potassium Titanyl Phosphate) |
| Crystal Face Dimensions | 1.0 mm x 2.0 mm |
| Clear Aperture | >80% of Crystal Face Area |
| Crystal Length | 30.00 mm |
| Surface Flatness | λ/6 @ 633 nm |
| Surface Quality | 10-5 Scratch-Dig |
| Phase Matching Temperature for Degeneracyb | 60 °C |
Features
- Periodically Poled Potassium Titanyl Phosphate (PPKTP) Crystals Optimized for Spontaneous Parametric Down Conversion (SPDC)
- Type-0 or Type-II SPDC
- 405/810 nm or 775/1550 nm
- Designed for Use with 404.5 - 406 nm (Item #s NLCK1 and NLCK2), 774 - 780 nm (Item # NLCK3), or 765 - 785 nm (Item # NLCK4) Pump Lasers
- Mounted in Customized Holder for Use in Thorlabs NLCH2(/M) Ovens (Sold Below)
Typical Applications
- Sub-Shot-Noise Imaging
- 2-Photon Interference
- Single-Photon Sensor Characterization
- Quantum Key Distribution
- Quantum Optics Education
- Heralded g(2) Measurements
- Absorption Spectroscopy
- Quantum Metrology
- Waveguide Characterization
- Building Entangled Photon Sources
Click to Enlarge
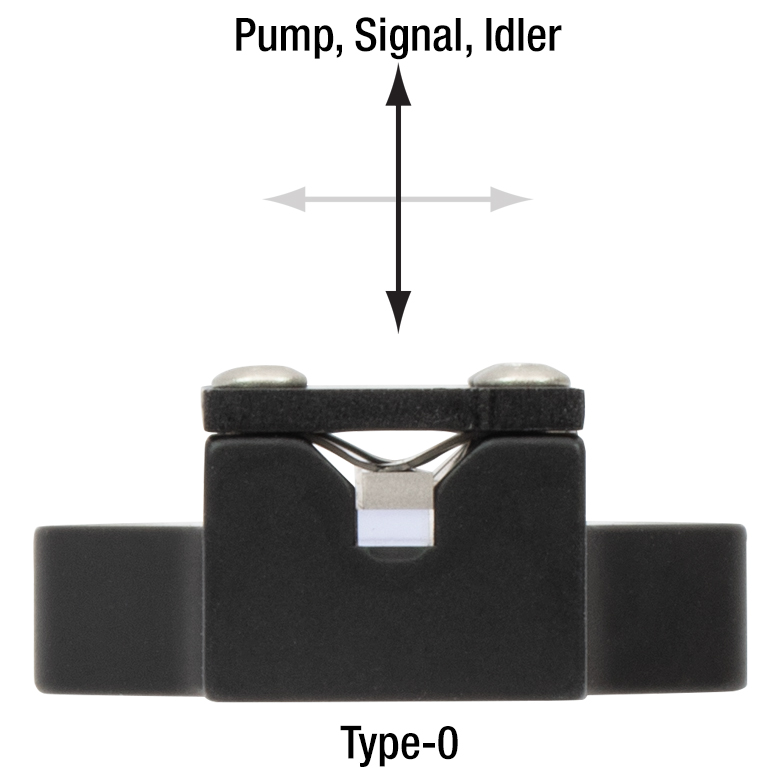
Figure 1.1 The polarization axes are aligned with the vertical arrow as shown for the pump, signal, and idler photons in type-0 SPDC.
Click to Enlarge
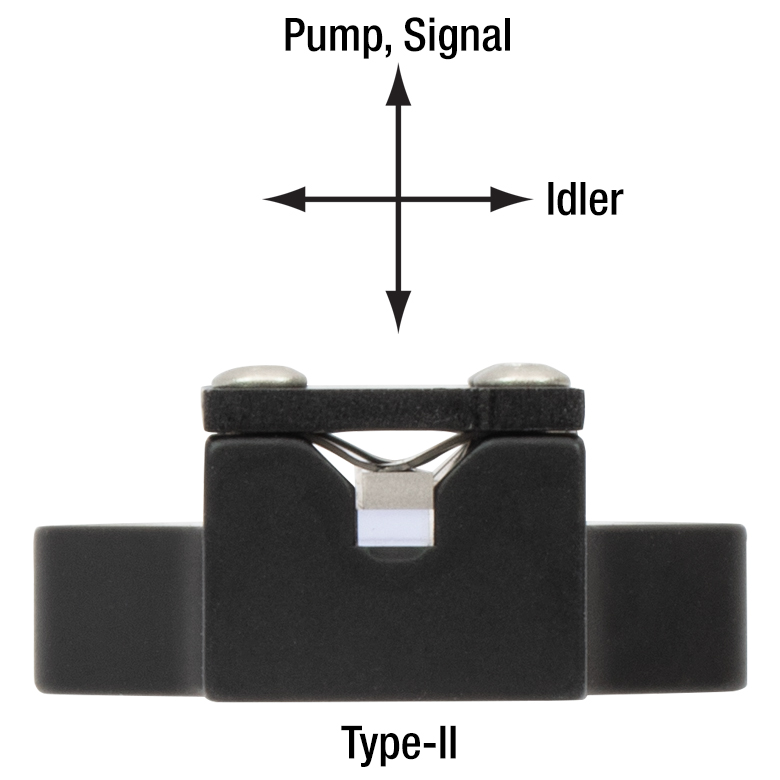
Figure 1.3 The polarization axes are shown for the pump, signal, and idler photons in type-II SPDC.
Click to Enlarge
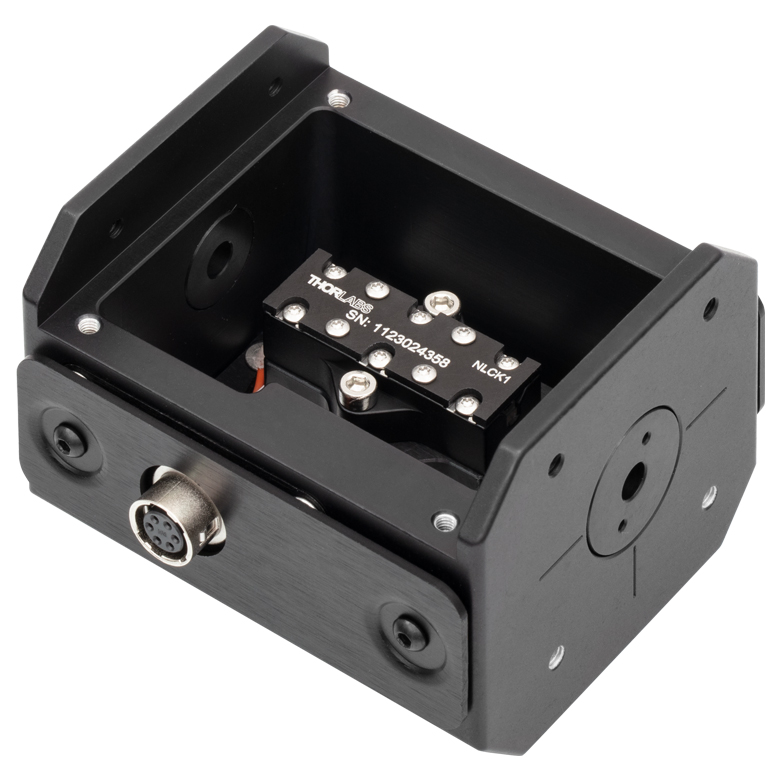
Figure 1.2 An NLCK1 SPDC crystal is shown mounted in an NLCH2 nonlinear crystal oven for temperature control.
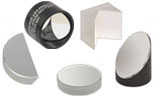
Thorlabs' PPKTP crystals for Spontaneous Parametric Down Conversion (SPDC) are designed for type-0 or type-II SPDC, a nonlinear process where a single high-energy pump photon is down converted into a signal and idler pair of lower-energy photons, conserving both energy and momentum in the process. SPDC is commonly used as a source for polarization-entangled photon pairs or as a heralded single-photon source. Type-0 SPDC outputs signal and idler photons with the same polarization as the pump polarization; this is illustrated in Figure 1.1, where the polarizations for the pump, signal, and idler photons are all oriented in the vertical direction. Type-II SPDC outputs signal and idler photons with polarizations perpendicular to each other, as shown in Figure 1.3. See the SPDC Tutorial tab for more detailed information about SPDC. Crystals are available for type-0 or type-II SPDC with pump wavelengths of either 405 nm or 775 nm.
SPDC is the reverse process of sum frequency generation (SFG) and, in the degenerate case, second harmonic generation (SHG). As such, these PPKTP crystals are very similar to crystals designed for second harmonic generation. The periodically poled design of these crystals results in greater photon generation efficiency (more signal/idler photon counts) for longer crystal lengths, at the cost of a blurring of the wavelength-position correlation of the photons. These SPDC-optimized PPKTP crystals are each 30.00 mm long. For more information on periodic poling and SPDC crystal design, please see the SPDC Tutorial tab.
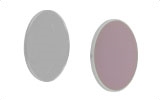
Each crystal has an antireflection (AR) coating to provide low reflectance (<0.5%) at the pump, signal, and idler wavelengths. For plots of the antireflection performance, see the Specs tab.
To distinguish between pump and signal/idler photons (especially for collinear SPDC), a high optical density long-pass filter should be used. An optical density of 10 or greater is recommended, which typically precludes the use of just a single filter. The 405/810 nm crystals produce signal and idler photons with wavelengths in the visible to NIR where single-photon detection is practical with detectors like the SPDMA Single Photon Detection Module. Detection of the SPDC photons produced by the 775/1550 nm crystals will require a single photon detector that operates more in the NIR to MIR range.
Mounting and Temperature Control
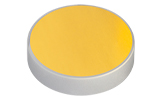
The crystals are each mounted in housings that are 21.0 mm wide, 31.0 mm long, and 9.8 mm tall with a clear aperture of >80% of the 1.0 mm x 2.0 mm crystal face area. Due to the substantial length of these crystals, temperature plays a significant role in the SPDC efficiency. We offer the NLCH2(/M) nonlinear crystal oven (sold below) that is designed for simple drop-in compatibility with these mounted PPKTP crystals (see Figure 1.2) in order to hold the temperature of the crystals constant for consistent and efficient SPDC photon generation. Each PPKTP crystal is optimized for degenerate SPDC at 60 °C with the design pump wavelength and therefore generally requires an oven for use; SPDC still occurs at different temperatures but will not be degenerate. The pump wavelength can also be adjusted to move toward or away from degeneracy. Depending on the input wavelength and desired output SPDC wavelength(s), the temperature of the crystals can be tuned to accommodate degeneracy for a slightly different pump wavelength or to move away from degeneracy and produce two different wavelength SPDC photons. For more information on the temperature dependence and tuning of SPDC, please see the SPDC Tutorial tab. Please see the Specs tab for more information on the temperature dependence of all of our PPKTP crystals.
Usage, Handling, and Care
Use care and always wear gloves when handling PPKTP crystals, as they can scratch easily. Protect the crystals from excess moisture such as high humidity environments. In high-humidity environments, desiccant can help prolong the lifespan of the crystal. If needed, we recommend removing dust by gently puffing with clean dry air only, as detailed in the Blowing Off the Surface of an Optic section in our Optics Handling and Care Tutorial.
| Item # | NLCK1 | NLCK2 | NLCK3 | NLCK4 | |
|---|---|---|---|---|---|
| Material | Periodically Poled Potassium Titanyl Phosphate (PPKTP) | ||||
| Crystal Length | 30.00 mm | ||||
| Crystal Length Tolerance | ±0.05 mm | ||||
| Poling Period | 3.400 μm | 9.925 μm | 24.650 μm | 46.025 μm | |
| Phase Matching Temperature for Degeneracy | 60 ± 10 °C | ||||
| Max Operating Temperature | 120 °C | 180 °C | |||
| Application | Type-0 SPDC | Type-II SPDC | Type-0 SPDC | Type-II SPDC | |
| Pump Wavelength at 60 °C | 405 nm | 775 nm | |||
| Signal/Idler Wavelength at 60 °C | 810 nm | 1550 nm | |||
| Temperature Tuning Sensitivitya |  |
 |
 |
 |
|
| AR Coating, Entrance Face, 0° AOI | R < 0.5% at 405 and 810 nm | R < 0.5% at 775 and 1550 nm | |||
| AR Coating Curves |  Raw Data |
 Raw Data |
|||
| Aperture Size | 1.0 mm x 2.0 mm | ||||
| Clear Aperture | >80% of Aperture Size | ||||
| Mounted Height (Bottom to Crystal Center) | 5.0 mm | ||||
| Surface Quality | 10-5 Scratch-Dig | ||||
| Surface Flatness | λ/6 @ 633 nm | ||||
| Physical and Optical Properties | ||
|---|---|---|
| Material | Periodically Poled Potassium Titanyl Phosphate (PPKTP) | |
| Crystal Structure | Orthorhombic mm2 | |
| Transparency Range | 350 - 4000 nm | |
| Second-Order Nonlinear Coefficientsa | d15 = 1.95 pm/V d24 = 3.9 pm/V d31 = 1.95 pm/V, d32 = 3.9 pm/V, d33 = 15.3 pm/V |
|
| Nonlinear Refractive Index (Kerr Index)b | 1.2 x 10⁻¹⁹ m2/W @ 780 nm | |
| Sellmeier Coefficients | nyc | |
| nzd | ||
| Temperature Dependencee | 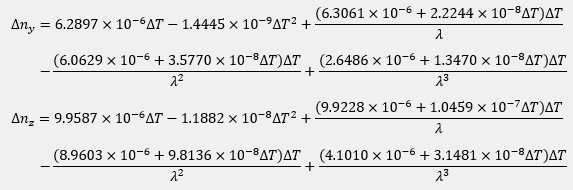 |
|
| Mohs Hardness | 5 Mohs | |
| Density | 3 g/cm3 | |
Spontaneous Parametric Down Conversion Setup
Figure 3.1 A schematic is shown of an example setup used to measure the number of spontaneous parametric down conversion (SPDC) photons generated from the 405 nm output of a L405A1 laser by passing through an NLCK1 type-0 SPDC crystal mounted in an NLCH2 nonlinear crystal oven held at 60 °C. We recommend mounting the oven on a PY005(/M) 5-axis stage for full alignment control. The linearly polarized beam is collimated and focused on the crystal using the A230-A and LA1484-A lenses, respectively. Output SPDC light is reflected by the DMSP567 dichroic mirror while the pump wavelength passes through to a beam block. Remaining traces of the pump wavelength are then filtered out of the reflected beam via an FGL715M longpass filter. Finally, the filtered SPDC photons are collected via an SPDMA single photon detector. For additional SPDC experimental setup ideas, please see the presentation for our Quantum Optics Education Kit.
Spontaneous Parametric Down Conversion and Phase Matching
Spontaneous Parametric Down Conversion (SPDC) is a common process for generating correlated photon pairs. In SPDC, a single pump photon generates two photons inside a nonlinear crystal, conserving both energy and momentum. These photons are created virtually simultaneously, so that one of the photons can be used to signal the existence of the other, making it possible to perform measurements on single photons. For this reason, the signal and idler photons are referred to as a herald (or heralding) and heralded photon. Additionally, degenerate type-II SPDC can be used to create polarization entangled photon pairs.
Optimizing for SPDC in our PPKTP crystals requires choosing a crystal appropriate to the wavelength of the pump laser and the appropriate temperature for the desired down conversion process. Tuning curves for each crystal offered are provided by the graphs in the Specs tab. Additional information and background, which can be helpful for interpreting the graphed data as well as more effectively using nonlinear crystals to generate down converted photons, is included in the expandable sections below. Information specific to our PPKTP crystals can be found in the section below titled How is the SPDC process tuned in periodically poled nonlinear crystals?
Click on a question to expand the corresponding passage that provides an answer, and then click again to contract the section.
What is nonlinear optics?

Click to Enlarge
Figure 4.1 A beam of light accumulates phase and is attenuated as it propagates through a linear medium, but the photons of the beam do not interact with each other. Due to this, the input (Ein) and output (Eout) electric fields have the same frequency (ω) and are directly proportional.

Click to Enlarge
Figure 4.2 This nonlinear optical medium supports second harmonic generation and the input light is the same as in Figure 4.1. In addition to providing fundamental-frequency electric fields, as in Figure 4.1, the light output from this nonlinear medium also includes frequency doubled light, whose electric field Eout(2ω) is proportional to the square of the total input electric field.
The field of nonlinear optics refers to different optical phenomena that can occur when light alters the properties of the surrounding material. These phenomena are called nonlinear optics because the strength of the material's response is proportional to the square, cube, or other higher power of the light's total electric field. Since the light usually must be intense to produce a measurable nonlinear response, laser light is often used to generate desired nonlinear effects.
A material's nonlinear response occurs in addition to the linear response, which is proportional to only the first power of the light's electric field. The interaction between the light and the material is completely conventional (linear) when optical and material conditions are not appropriate for generating nonlinear phenomena. Then, light waves in a material propagate together without affecting one another, whether or not they are part of the same beam or pulse.
An example of a material's linear response to light is illustrated in Figure 4.1, in which an input beam is described by its electric field amplitude (Ein), frequency (ω), and polarization orientation (vertical). The beam accumulates phase and experiences conventional losses from effects like reflection and material absorption before it is output, but otherwise the beam is unaffected. The total electric field (Eout) output by the material has an amplitude that is directly proportional to the that of the input beam. In addition, the input and output light has the same frequency and polarization direction.
Nonlinear processes occur when the presence of the light in the material creates conditions in which different light waves can interact with one another. In some cases, light waves from the same beam or pulse interact, and in other cases light waves with significantly different frequencies and / or polarizations interact. Nonlinear phenomena include the generation of new frequencies of light, lensing of laser light propagating in uniform materials, and modulation effects. In the case of frequency generation, the light output by the nonlinear material will include a frequency of light different than any of the input beams' frequencies.
An example of nonlinear frequency generation is illustrated in Figure 4.2, in which the light is incident on a nonlinear optical material. While the incident light is the same as in Figure 4.1, the material supports second harmonic generation, and the electric field output from this crystal includes a new color, which has double the frequency of the input beams. The amplitude of this frequency-doubled light is proportional to the square of the total input electric field, and the losses accumulated by the two fundamental-frequency beams include the photons converted into frequency-doubled light.
What is spontaneous parametric down conversion (SPDC)?

Click to Enlarge
Figure 4.3 Conservation of momentum in non-collinear spontaneous parametric down conversion requires an angular deviation of the signal (ks) and idler (ki) photons to compensate for the larger magnitude of the sum of their momenta.
Click to Enlarge
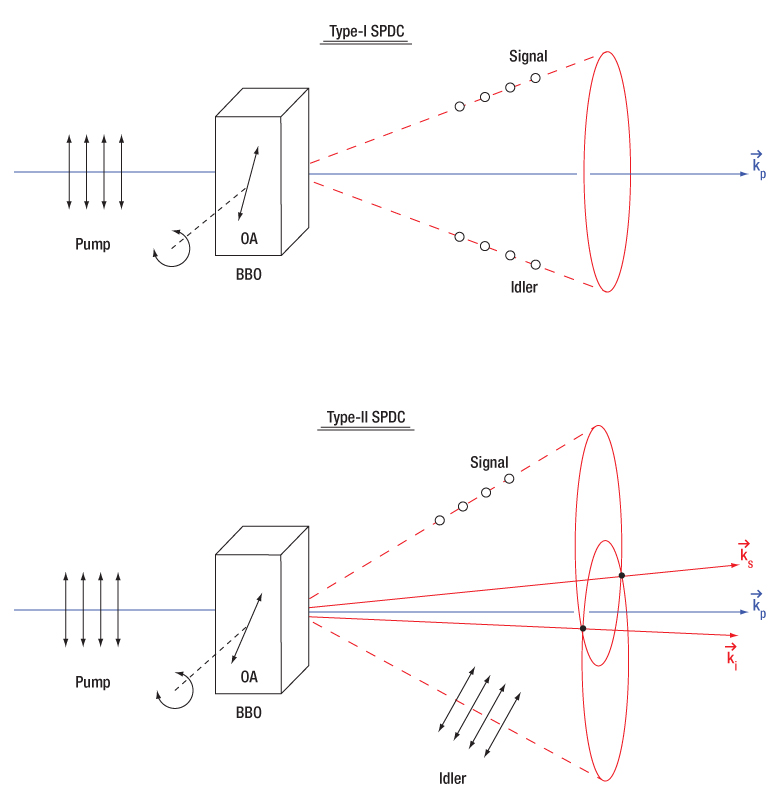
Figure 4.4 The signal and idler photons emitted during spontaneous parametric down conversion form either a cone (type-I SPDC) or a pair of cones (type-II SPDC). The two intersection lines between the signal and idler emission cones in type-II SPDC (labeled ks and ki, respectively) are the wavevectors that correspond to polarization entangled photons. The optical axis (OA) of the crystal can be changed by rotating the crystal, altering the phase matching conditions. This diagram shows noncollinear SPDC emission, but collinear emission with a gaussian profile is also possible.
Spontaneous Parametric Down Conversion
Spontaneous parametric down conversion (SPDC) is the reverse process to sum frequency generation (SFG). One common example of degenerate SFG, called second harmonic generation (SHG), is used to generate 532 nm wavelength photons from a 1064 nm pump laser. Unlike SFG, however, SPDC cannot be explained by classical fields. The SPDC process is called spontaneous (as opposed to stimulated) because the photon pair is created without the presence of an external electromagnetic field at the signal wavelength. Classical theories only allow for the generation of an idler and signal beam if a weak signal beam already exists, a process called parametric amplification. Therefore, the existence of the SPDC process can only be explained with quantum mechanics.
Conservation of Energy and Momentum in SPDC
Since energy and momentum are conserved in the SPDC process, the energy and momentum of the photon being down converted must be equal to the energy and momentum of the pair of output photons. The implication of this conservation is that experimental parameters must be set up to allow for conservation of energy and momentum during SPDC or else the process cannot proceed. The following example demonstrates how this conservation determines experimental parameters such as the photon output angles, polarization states of the output photons, and the nonlinear crystal cut angle.
In general, the output idler and signal photons will have propagation directions that fall on the surface a cone (type-I SPDC) or a pair of cones (type-II SPDC), as shown in Figure 4.4. These conical emission patterns can be observed as annuluses when viewed on a plane. Conservation of momentum requires that the sum of the wave vectors for these resulting output photons be equal to that of the input pump photon.
To simplify the calculations, let's look at the collinear case of SPDC, where the pump, signal, and idler photons are all propagating in the same direction. In this case, both the energy and momentum conservation relations simplify to scalar equations:
and
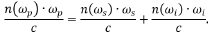
Here, ω represents the angular frequency of the photon and k the magnitude of the wave vector. The indices p, s, and i stand for pump, signal, and idler, respectively. The frequencies and wavevectors of each of these three photons are not independent but linked via the expression
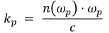
where n(ωp) is the frequency-dependent index of refraction of the crystal at the pump frequency ωp, and c is the speed of light in vacuum. The signal and idler photons have analogous relations which together allow for the conservation of momentum expression to be rewritten as:
Degenerate SPDC
For the further simplifying case of degenerate SPDC, we can assume the wavelength (and thus frequency ω) of the signal and idler photons are the same and thus the previous expression simplifies to:
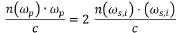
where (ωs,i) is the frequency of the degenerate signal and idler photons. Since ωp = 2 (ωs,i) for energy conservation, this demonstrates that we need the same index of refraction for both the short-wavelength pump and long-wavelength signal/idler photons, i.e. n(ωp) = n(ωs,i). This can be accomplished through the use of birefringent crystals, which have different indices of refraction for different polarizations of light. The crystal orientation can be rotated with respect to the input polarization of the pump beam to create the appropriate phase matching conditions to conserve energy and momentum and allow for spontaneous parametric down conversion.
Categories of SPDC
Stepping back from the simple case above, SPDC can be broken down into three categories all dealing with how the process is phase matched: collinear vs non-collinear wavevector orientations, type-0 versus t
Additional discussion on the SPDC categories and tuning between them is found below in the How is the SPDC process tuned in homogeneous nonlinear crystals? section.
Can all crystals be used for SPDC?
Only optical materials which have a non-zero χ(2) parameter support SPDC, and not all crystals fulfill this requirement. An example of a crystal that can be used for SPDC is β-BBO. A material is crystalline when its atoms, ions, or molecules are arranged in a repeating pattern. If there is no central point around which the crystal pattern is symmetric (i.e. if the crystal is not centrosymmetric), the crystal has a non-zero χ(2) parameter and can be used for SPDC.

Click to Enlarge
Figure 4.6 When light's oscillating electric field interacts with a centrosymmetric material, an electron's induced potential energy, which is illustrated as a function of the electron's displacement (x) from its equilibrium position, is symmetric and described by a polynomial function consisting of even powers of x.

Click to Enlarge
Figure 4.5 This cubic crystal structure includes two different ions, A and B, in a repeating pattern. The crystal structure is centrosymmetric since the crystal at point (x, y, z) and its inverse (-x, -y, -z) are identical.

Click to Enlarge
Figure 4.8 When light's oscillating electric field interacts with a non-centrosymmetric material, an electron's induced potential energy, which is illustrated as a function of the electron's displacement (x) from its equilibrium position, is asymmetric for larger displacements. This curve is described by a polynomial function consisting of even and odd powers of x.

Click to Enlarge
Figure 4.7 This wurtzite crystal structure includes two different ions, A and B, in a repeating pattern. The crystal structure is not centrosymmetric since there is at least one point (u, v, w) which is not identical to its inverse (-u, -v, -w).
Centrosymmetric Crystal
The repeating crystalline pattern of one type of centrosymmetric crystal is illustrated in Figure 4.5. As is true for all centrosymmetric crystals, the structure at point (x, y, z) is identical to the structure at the inverse location (-x, -y, -z). Due to the crystal's structural symmetry, the material's response is the same whether the incident light's electric field vector points in one direction or in the opposite direction.
The material’s response to light occurs due to interactions between the light’s oscillating electric field and the electrons in the material. An electron bound to an atom in the material experiences forces contributed by the atom and the light’s electric field, as well as the surrounding atoms in the material. The blue curve in Figure 4.6 was calculated using the Lorentz model of an atom, which takes these forces into account using a classical mechanics approach. This model can also be used to estimate the χ(2) parameter.
In Figure 4.6, the X-axis corresponds to the position of the electron, which is in equilibrium at x = 0. The input light’s oscillating electric field moves the electron back-and-forth between positive and negative displacements. The greater the intensity of the electric field, the larger the displacement of the electron. The central and surrounding atoms exert a restoring force on the displaced electron, returning it to equilibrium. This restoring force provides the electron with potential energy, which is plotted on the Y-axis and increases as the electron moves further from equilibrium.
At moderate displacements, the central atom exerts the majority of the restoring force, and the electron’s corresponding potential energy is symmetric and approximately parabolic (the dashed gray curve is a parabolic fit). At larger displacements, achieved using higher-intensity light, surrounding atoms contribute more to the restoring force, as well as the electron’s potential energy. At these larger displacements, the electron’s potential energy deviates from parabolic but remains symmetric.
The symmetric material response is a consequence of the centrosymmetric structure of the crystal. In order to support SPDC, this curve would have to be asymmetric. Mathematically, a non-zero χ(2) parameter requires the polynomial describing the curve to include odd powers of x, while the polynomial describing the curve in Figure 4.6 includes only even powers of x.
Non-Centrosymmetric Crystal
An example of a non-centrosymmetric material is shown in Figure 4.7. In the case of these materials, there is aways at least one location (u, v, w) for which the crystal structure differs from the crystal structure at the inverse location (-u, -v, -w).
The potential energy of an electron, as a function of its displacement from its equilibrium position, has been calculated for a non-centrosymmetric material using the Lorentz model of the atom (Figure 4.8). When the incident light has low intensity, the displacement of the electron from its equilibrium position is small, and the majority of the restoring force is provided by the central atom. Within this limited region, the electron's corresponding potential energy function is symmetric and approximately parabolic, which indicates a linear optical material response. When illuminated by higher-intensity light, the electron's displacement is greater and the surrounding atoms contribute more to the restoring force. Since the distribution of the surrounding atoms is not symmetric, neither is the restoring force nor the potential energy well confining the electron for these higher displacements.
The polynomial needed to model this asymmetric curve includes even, as well as odd, powers of x. It is the non-zero cubic (x3) terms in this polynomial that provide a non-zero χ(2) parameter. A third-order polynomial term is required for the generation of the second-order nonlinearities quantified by the χ(2) parameter, since the x3 term is the lowest-order correction to the linear optics model. Because the asymmetric response only becomes significant for larger electron displacements, high-intensity light is required to induce SPDC.
Uniaxial Crystal
A secondary requirement for efficient production of light through nonlinear processes, which will be discussed in a section below, is the so-called phase matching condition. At a high level, phase matching is the conservation of momentum between the input and output photons of the nonlinear process. This is frequently accomplished by utilizing the birefringence of anisotropic optical materials.
Uniaxial crystals are a specific type of anisotropic material, where two of the three principal refractive indices are the same. The name “uniaxial” is derived from there being a single propagation axis in these crystals, known as the optical axis or c-axis, on which the index of refraction is the same for all polarization orientations. Many common optical materials belong to the uniaxial class: calcite, quartz, sapphire, and β-BBO.
Reference:
Robert W. Boyd, Nonlinear Optics (Academic Press, New York, 1992) pp. 17 - 52.
Can a crystal's refractive index depend on the light's polarization orientation within the crystal?
Certain materials have a refractive index that depends on the orientation of the light's electric field polarization. An example is birefringent materials, which include uniaxial crystals like β-BBO. Uniaxial crystals characteristically have two principal refractive indices, which are called the ordinary (no) and extraordinary (ne) refractive indices. The principal refractive indices are the maximum and minimum the material can provide. Since light’s electric field (E) is always polarized perpendicular to the propagation direction (k), both the propagation direction and polarization state must be known to determine the refractive indices experienced by the light's polarization components.
A Cartesian coordinate system, with the Z-axis aligned along the crystal’s optic axis (c), can be used to relate the light's polarization components (Ex, Ey, and Ez) to a birefringent crystal's geometry.
In uniaxial crystals, the refractive index can be determined by referencing the angles of the propagation direction and polarization orientation relative to the crystal's optic axis (c).
Since the crystal is uniaxial, the refractive index for fields polarized orthogonal to the crystal's optic axis is no. For fields parallel to the crystal's optic axis, the refractive index is ne. The two components (Ex and Ey) of light polarized orthogonal to the crystal's optic axis have refractive indices equal to no, since the crystal is uniaxial. Light polarized parallel (Ez) to the crystal’s optic axis has a refractive index equal to ne.
It is also possible for birefringent materials to provide a refractive index value between no and ne, which is discussed in a following section.

Click to Enlarge
Figure 4.9 The diagram on the left indicates the propagation direction (k) of the incident light is along the optic axis (c) of the crystal. The incident light can be decomposed into orthogonal polarization components Ex and Ey. The diagram on the right is a refractive index ellipsoid, with a conic section (red circle) at the XY-plane. This constant-radius circle shows the refractive index is always no in this case and the crystal does not affect the light's polarization.
Light Propagating Parallel to the Optic Axis
(Example: Optical Windows)
Light propagating along the optic axis (Z-axis) of a birefringent material always has a refractive index equal to no. This is a defining trait of the optic axis.
The left side of Figure 4.9 illustrates the electric field components of light propagating along the crystal's optic axis. These polarization state components can include Ex and Ey, but not Ez. In other words, the electric field vector is orthogonal to the Z-axis, so the angle φ equals 90°. The relative magnitude of Ex and Ey depends on angle α.
The right side of Figure 4.9 uses an ellipsoidal volume, the so-called index ellipsoid, to map all possible refractive indices provided by the material for all combinations of light propagation directions and polarization orientations. In the case of this material, the maximum possible refractive index is ne and the minimum is no. The opposite can be true for other materials. The red circle drawn on the ellipsoid is a conic section that marks the refractive indices that light propagating along the optic axis will experience. The refractive index of both Ex and Ey components equals no. Due to this, E has a refractive index of no, regardless of the orientation of the E vector in the XY-plane. Therefore, the Ex and Ey components travel with the same phase velocity, and the polarization state stays the same as the light propagates.
Optical windows made from uniaxial crystals, such as sapphire (for example Item # WG31050), are typically cut or polished so that normally incident light propagates parallel to the optic axis. This is done so that the window has no effect on the polarization state of the transmitted light, as described above. When the end faces are orthogonal to the optic axis like this, the crystal is often described as Z-cut or C-cut.

Click to Enlarge
Figure 4.10 The diagram on the left indicates the incident light's propagation direction (k) and polarization state orientation (E), which can be decomposed into orthogonal components Ex and Ez. The propagation direction is aligned to the Y-axis and is orthogonal (θ = 90°) to the optic axis (c) of the crystal. The diagram on the right is a refractive index ellipsoid, with conic sections (red ellipses) drawn in the XZ- and XY-planes. The refractive index (ne) of the extraordinary component (Ee = Ez) is indicated by the intersection of the Z-axis and ellipse, while the refractive index (no) of the ordinary component (Eo = Ex) is indicated by the intersection of the X-axis and the ellipse. The angle φ determines the two components' relative magnitudes.

Click to Enlarge
Figure 4.11 The diagram on the left indicates the incident light's propagation direction (k), which is aligned to the Y-axis, which is orthogonal (θ = 90°) to the optic axis (c) of the crystal. Since φ is 0°, the only polarization component is Ez, which is also the extraordinary component. The diagram on the right indicates this component has a refractive index of ne.

Click to Enlarge
Figure 4.12 The diagram on the left indicates the incident light's propagation direction (k), which is aligned to the Y-axis, which is orthogonal (θ = 90°) to the optic axis (c) of the crystal. Since φ is 90°, the only polarization component is Ex, which is also the ordinary component. The figure on the right indicates this component has a refractive index of no.
Light Propagating Perpendicular to the Optic Axis
(Example: Wave Plate)
When linearly polarized light incident on a birefringent material propagates in a direction orthogonal to the optic axis (θ = 90°), the light may have components polarized both parallel and perpendicular to the optic axis (Z-axis). This is illustrated in Figure 4.10, in which the light’s propagation direction is aligned to the Y-axis for convenience. The refractive index of the electric field component parallel to the optic axis (Ez) is ne, and the component perpendicular to the optic axis (Ex) is no. This is the largest refractive index difference that can exist between two polarization components in the material.
The vertical, red circle on the right side of Figure 4.10 is the conic section of the index ellipsoid in a plane perpendicular to the k-vector. The horizontal, red elliptical conic section indicates a difference between the refractive indices of the orthogonal principal polarization axes of ![]() and
and ![]() .
.
Due to different refractive indices, the two polarization components travel at different velocities as they propagate through the material. This causes a phase shift between the two polarization states Ez and Ex.
Wave plates are often fabricated from uniaxial birefringent materials, with the optic polished and mounted so that normally incident light propagates orthogonal to the optic axis. Markings on the wave plate housing, such as the ones on Item # WPQ05M-266, or flat features on the perimeter of the optic, identify the orientations of the ordinary and extraordinary axes, or for a typical waveplate made of crystal quartz the so-called fast and slow axes, respectively.
Light polarized parallel to the fast axis travels with a faster velocity in the material due to the lower refractive index, compared with light polarized parallel to the slow axis. Quartz, a commonly used waveplate material, is a positively uniaxial crystal with a smaller ordinary refractive index compared to its extraordinary index. For quartz, the fast axis is the ordinary axis.
Tuning a wave plate requires rotating the optic in the XZ-plane, around the Y-axis, so that the light's propagation direction is maintained perpendicular to the optic axis. This rotation changes the angle φ, while keeping θ = 90°.
When the angle φ is between 0° and 90°, the linear polarization state has both orthogonal Ex and Ez components, and the wave plate will delay one component relative to the other. However, note that since θ is unchanged, there is no change in the indices of refraction of the two principal orthogonal polarization orientations along ![]() and
and ![]() .
.
When φ = 0°, as illustrated in Figure 4.11, the light's polarization state is oriented along the optic axis. This provides an extraordinary component (Ez = Ee) without an ordinary component. This component has a refractive index equal to ne. Since there is only one polarization component, the wave plate does not affect the polarization state.
The polarization state is similarly unaffected when the linear polarization state is aligned with the X-axis (φ = 90°), as seen in Figure 4.12. In this case, there is an ordinary component (Ex = Eo) without an extraordinary component and the refractive index is no.

Click to Enlarge
Figure 4.13 In the diagram on the left, the propagation direction (k) of the incident light and the optic axis (c) of the uniaxial birefringent crystal are in the same plane (XZ plane). The angle (θ) between k and c is arbitrary. The input fundamental field, represented by the red vector, is parallel to the Y-axis. The SHG light is polarized perpendicularly, represented by the green vector in the XZ plane. Rather than decompose the SHG polarization into components Ex and Ez, the light is typically described as an extraordinary wave (E'e) with a refractive index, n'e. In the diagram on the right, n'e, which depends on θ, is indicated by the intersection of the conic section illustrated by the red ellipse with the XZ plane.

Click to Enlarge
Figure 4.15 How θ and γ are defined in a laboratory setup.

Click to Enlarge
Figure 4.14 In the diagram above, the propagation direction (k) of the incident light and the optic axis (c) of the uniaxial birefringent crystal are in the same plane (XZ-plane). The angle (θ) between k and c is arbitrary. In this case, the incident fundamental field (E), represented by the red vector, is rotated off of the laboratory reference frame by an angle γ, and thus only a portion of the fundamental (Eoγ) is converted by SHG into the resulting polarization E'e, represented by the green vector.
Light Propagating at an Arbitrary Angle
(Example: Nonlinear Crystals)
This is a case study using type-I second harmonic generation (SHG) as an example of an application of birefringent crystals in nonlinear optics. SHG is the reverse case of degenerate SPDC, so this treatment will be instructive.
In uniaxial crystals, the field polarizations are arranged as in Figure 4.13 for type-I second harmonic generation (SHG). The k-vector is at an angle θ from the optic axis, ![]() , and in the XZ plane. The input fundamental electric field (Eo) is polarized parallel to one of the principal ordinary axes, in this case the Y-axis, and has a refractive index of no. The index of refraction for light polarized in the ordinary direction, parallel to
, and in the XZ plane. The input fundamental electric field (Eo) is polarized parallel to one of the principal ordinary axes, in this case the Y-axis, and has a refractive index of no. The index of refraction for light polarized in the ordinary direction, parallel to ![]() , is independent of changes to θ.
, is independent of changes to θ.
The SHG light is polarized in the XZ plane and is orthogonal to both the Eo and the k-vector. Rather than decompose the polarization of the SHG light into Ex and Ez components, the electric field is typically described as an extraordinary wave (E'e). The refractive index for this extraordinary wave, n'e, changes as a function of θ. n'e(θ) can be calculated using the equation in Figure 4.13. The ellipse defining the extraordinary index of refraction as a function of θ is a conic section of the index ellipsoid. The two extreme cases are 1) θ = 0°, where the field is polarized along the other principal ordinary axis, ![]() , and the index of refraction is no, or 2), θ = 90°, where the field is polarized along the principal extraordinary axis,
, and the index of refraction is no, or 2), θ = 90°, where the field is polarized along the principal extraordinary axis, ![]() , and the index of refraction is ne. The prime (') notation is used to denote index of refraction for cases in between the two extreme cases of θ.
, and the index of refraction is ne. The prime (') notation is used to denote index of refraction for cases in between the two extreme cases of θ.
Figure 4.14 shows a departure from an ideal polarization orientation for type-I SHG, where the incident fundamental field has a linear polarization but is rotated by a degree γ from the principal ordinary axis ![]() . The fundamental field now driving the type-I SHG process is the Eoγ component of the incident field. At γ = 90°, there would be zero SHG output, since the drive field Eoγ = 0.
. The fundamental field now driving the type-I SHG process is the Eoγ component of the incident field. At γ = 90°, there would be zero SHG output, since the drive field Eoγ = 0.
In practice, γ is nonzero when the polarization states of light in a laboratory reference frame are not matched to the intrinsic principal axes in the crystal frame. To orient the two reference frames together, e.g. the vertically polarized light from the laser on the optical table is parallel to ![]() in the crystal, we mount the nonlinear crystal in a rotation stage to finely adjust γ to zero, first by eye using the markings on the housing and then further, if necessary, using the SHG output power as feedback. Figure 4.15 shows the orientation of γ in a laboratory frame rotation of the crystal. In this example case, the nonlinear crystal is mounted in an RSP1 rotation mount on top of an RP01 rotation stage. Changes in γ and θ adjust the orientation of the optic axis,
in the crystal, we mount the nonlinear crystal in a rotation stage to finely adjust γ to zero, first by eye using the markings on the housing and then further, if necessary, using the SHG output power as feedback. Figure 4.15 shows the orientation of γ in a laboratory frame rotation of the crystal. In this example case, the nonlinear crystal is mounted in an RSP1 rotation mount on top of an RP01 rotation stage. Changes in γ and θ adjust the orientation of the optic axis, ![]() . In this case, adjustments in γ have been used to align
. In this case, adjustments in γ have been used to align ![]() with the horizontal plane and one of the principle ordinary axes vertically. For a vertically polarized input beam, this orientation allows the rotation stage to be used to adjust θ.
with the horizontal plane and one of the principle ordinary axes vertically. For a vertically polarized input beam, this orientation allows the rotation stage to be used to adjust θ.
How is the SPDC process tuned in homogeneous nonlinear crystals?
Click to Enlarge
Figure 4.15 The signal and idler photons emitted during noncollinear spontaneous parametric down conversion form either a cone (type-I SPDC) or a pair of cones (type-II SPDC). The two intersection lines between the signal and idler emission cones in type-II SPDC (labeled ks and ki, respectively) are the wavevectors that can correspond to polarization entangled photons. This type-II SPDC diagram shows noncollinear SPDC emission, but collinear emission with a gaussian profile is also possible.
Click to Enlarge
Figure 4.16 For SPDC, it is necessary for the pump and signal/idler photons to experience the same index of refraction despite their different wavelengths. Birefringent materials like β-BBO allow for this by having different indices of refraction for two crystal axes so that photons with different polarizations and different wavelengths can be phase matched.
Tuning Type-I, Degenerate, Non-Collinear SPDC
In the following example, degenerate non-collinear spontaneous parametric down conversion (SPDC) with a 405 nm pump is used to demonstrate how tuning is performed. Using the same logic, degenerate and non-degenerate SPDC tuning can be achieved for any pump wavelength. This example, where the degenerate signal and idler have the same polarization, perpendicular to that of the pump, is called type-I SPDC, as shown in the upper panel of Figure 4.15. In contrast, for type-II SPDC, the signal and idler have polarizations perpendicular to each other, with one being parallel to the pump polarization, as shown in the lower panel of Figure 4.15.
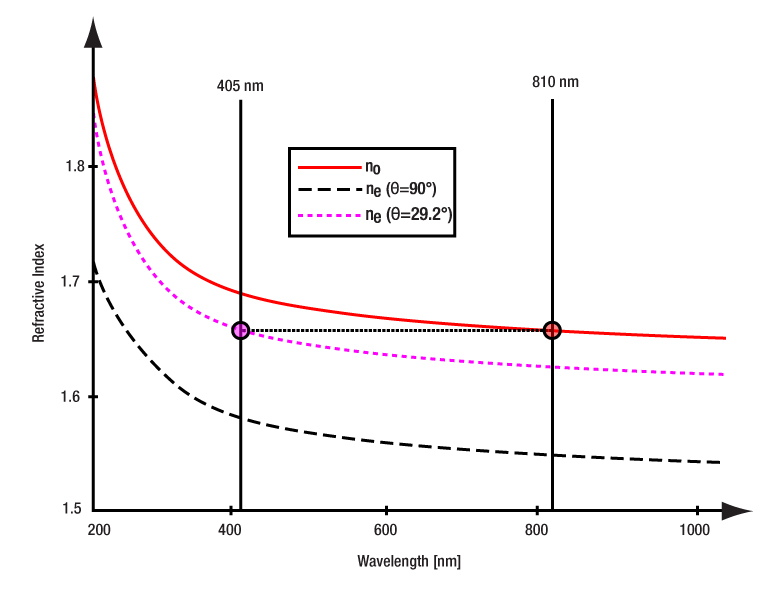
As discussed previously, for SPDC to occur, the index of refraction within the nonlinear crystal for the pump at 405 nm must be the same as the index of refraction for both the signal and idler at 810 nm. The refractive index as a function of wavelength for β-BBO is shown in Figure 4.16. The red solid curve indicates the refractive index for the ordinary beam (no). The black dashed curve is the refractive index for the extraordinary beam (ne) if the input beam is orthogonal to the crystal plane. By rotating the crystal axes relative to the wavevector of the incident pump, the refractive index curve can be moved until ne (405 nm, pump) = no (810 nm, signal/idler). This is called phase matching and allows for efficient SPDC from pump photons at 405 nm to signal and idler photon pairs at about 810 nm each. In this example, the optic axis of the crystal must be at an angle of 29.2° relative to the incident 405 nm pump beam to allow for optimal phase matching. Typically, a crystal cut to a similar angle (like our NLCQ1, NLCQ2, or NLCQ3 crystals for this example) would be used to allow for near-normal incidence and maximizing of the clear aperture.
Thorlabs' β-BBO crystals are designed to provide near-phase-matched conditions for normally incident input light for a specified set of wavelengths. The faces of the β-BBO crystals are cut such that the angle between the normally incident light and the optic axis is approximately the phase-matching angle for the specified frequencies. See the Specs tab for detailed specifications for the crystals currently available. The phase matching angle can be tuned by rotating the crystal to alter the angle between the optical axis (OA) and the incident pump as shown in Figure 4.15. An adjustment of typically only a few degrees can either optimize the performance of the crystal in the setup or match another wavelength within the crystal's operating range.
Tuning Between Type-I and Type-II SPDC
Depending on the exact phase matching parameters, the signal and idler photon pairs either leave the crystal either collinearly with the same mode as the pump beam, or non-collinearly on a cone with a small opening angle. The angle of the cone and wavelengths of the signal/idler pair can be tuned by adjusting the angle of incidence to the crystal.
For type-I SPDC (see the upper panel of Figure 4.15), in the specific example discussed above, the degenerate noncollinear signal and idler photons emit in a singular annular cone with a half angle of 2.88°. Rotating the crystal's optical axis to an angle of 28.64° changes the degenerate phase matching condition from non-collinear to collinear, collapsing the conical emission pattern to a Gaussian spatial mode collinear with the pump.
Due to the large difference in angle between type-I and type-II SPDC, it is often necessary to use crystals with different cut angles. For example, Thorlabs' NLCQ1 β-BBO crystal is cut at 29.2° to enable type-I phase matching with a 405 nm pump and degenerate 810 nm output at near-normal incidence. For type-II SPDC at the same wavelengths, Thorlabs' NLCQ4 BBO crystal cut at 41.8° would allow for phase matching at near normal incidence.
For type-II SPDC (see the lower panel of Figure 4.15), the signal and idler have distinct noncollinear emission cones each with a half angle of 5°. The signal and idler emission cones are separated from each other by a half angle of 1.7°. This results in the two cones intersecting at two lines. For larger increased negative angular offset (larger optic axis angle relative to the pump propagation), the individual cone half angles increase but the separation is relatively un-changed. Due to the increased cone half angle, the intersection lines of the two emission cones move outwards (transverse). As the AOI is tuned towards the collinear case, the two noncollinear annular emission cones separate and then collapse back to the collinear Gaussian modes.
It is important to note that for a pump wavelength of 405 nm, the wavelength of the signal and idler photons will not always be exactly 810 nm. It is also allowed that photon pairs can be of differing wavelengths, such as 812 nm and 808 nm. In those cases, the photon with the longer wavelength (lower energy) makes a slightly larger angle with the pump beam and vice versa. This wavelength deviation is limited by how well the phase matching is fulfilled at the different wavelengths, as the efficiency of the SPDC process will drop sharply with non-optimal phase matching.
The broad phase matching criteria for these crystals allows for photon pairs to be emitted under a vast range of wavelengths and angles. This means that photons generated by SPDC are distributed over a large spatial region. When measuring with two detectors in coincidence, one must be careful that detectors are positioned in the correct location so that they are able to detect photons from the same signal/idler pair.
The Effect of Crystal Thickness on SPDC
While phase matching can be achieved with a wide variety of wavelengths, crystals, and geometries, optimizing the system for the desired output introduces many more variables that should be considered. One such factor is the thickness of the crystal. Thicker crystals can provide a higher photon pair generation rate for a given pump power as there is a longer path for the light to interact with the crystal. However, increasing thickness also blurs the wavelength-position correlation of the SPDC photons, as pairs created at different spots in the crystal have different points of origin for the cone on which they are emitted. In type-II SPDC, the birefringent material of β-BBO causes differing group velocities in the ordinary and extraordinary axes due to different indices of refraction, causing temporal walk-off between the perpendicularly polarized signal and idler photons. This effect acts to label the signal and idler photons, reducing the quality of entanglement. As this temporal walk-off is a propagation effect, it scales linearly with increasing crystal thickness.
Thicker crystals also tighten the pump bandwidth for a given set of phase matching conditions as seen in Figure 4.17. More consequentially, the thicker crystals also result in tighter angular bandwidth for the emitted signal and idler photons, see Figure 4.18. This tighter angular distribution reduces the wavelength-position correlation and can make it more challenging to isolate specific photon pairs, since in an actual experiment an iris is typically used to spatially filter the output signal and idler beams, thus passing a more restricted range of wavelengths.
Click to Enlarge
Figure 4.17 As crystal thickness increases, the pump bandwidth that is phase-matched gets narrower. In this series of calculations, a fixed output wavelength was chosen and the resulting pump wavelengths that can achieve phase matching are plotted. This theoretical data was calculated with the web tool SPDCalc.
Click to Enlarge
Figure 4.18 The angular dispersion of the emitted signal and idler photons becomes tighter with increasing crystal thickness. This theoretical data was calculated with the web tool SPDCalc.
How is the SPDC process tuned in periodically poled nonlinear crystals?
Click to Enlarge
Figure 4.19 Quasi-phase matching is achieved in periodically poled materials by repeatedly inverting the crystal domain orientation at the length that maximizes constructive interference between the newly generated photons and the previously generated photons from earlier in the crystal. The optimal poling period depends on the crystal properties as well as the wavelengths of the pump, signal, and idler photons. In a non-phase matched crystal, the generated photons build up and then decay, while in a quasi-phase matched crystal, the generated photons build up to a local maximum, the domain is inverted and buildup occurs again to a next maximum, and the process repeats itself, leading to a continual buildup of generated photons.
Phase Matching and Quasi-Phase Matching
Different crystals used for SPDC are designed for different methods of phase matching. Traditional phase matching is performed for homogeneous birefringent crystals, which have different indices of refraction for different polarizations of light. The crystal orientation can be rotated with respect to the input polarization of the pump beam to create the appropriate phase matching conditions to conserve energy and momentum and allow for nonlinear processes like SHG, SFG, or SPDC to be optimally efficient. In quasi-phase matching, the crystal itself is engineered through periodic poling to correct for the differing phases within the material instead of by tuning the angle of incidence.
By designing a crystal such that a photon passing through will experience a periodic reversal of the crystal’s polarity, at a particular wavelength, this will allow the generation of SPDC photons to build constructively over the path length through the crystal, as illustrated in Figure 4.19.
Tuning Type-0 and Type-II, Degenerate, Collinear SPDC
This periodically poled crystal structure allows for type-0 SPDC, which was not achievable in homogenous crystals. Figure 4.20 illustrates the difference in signal and idler outputs between our periodically poled nonlinear crystals that are designed for type-0 or type-II SPDC. The case where the degenerate signal and idler have the same polarization, parallel to that of the pump, is called type-0 SPDC, as shown in the upper panel of Figure 4.20. In contrast, for type-II SPDC, the signal and idler have polarizations perpendicular to each other, with one being parallel to the pump polarization, as shown in the lower panel of Figure 4.20.
Click to Enlarge
Figure 4.20 The signal and idler photons emitted during collinear spontaneous parametric down conversion have polarization aligned either parallel to the pump photons (type-0) or with the signal perpendicular to the pump and the idler parallel to the pump (type-II).
Thorlabs' periodically poled potassium titanyl phosphate (PPKTP) crystals are designed for quasi-phase matching with the crystal temperature around 60 °C and either a pump wavelength around 405 nm (for Item #s NLCK1 and NLCK2) in order to efficiently produce degenerate SPDC photons at around 810 nm, or a pump wavelength around 775 nm (for Item #s NLCK3 and NLCK4) for SPDC at around 1550 nm.
Tuning Degeneracy in Quasi-Phase Matched SPDC Crystals
As an example, let's look at some data for the case of degenerate collinear SPDC with a 405 nm pump to demonstrate how tuning is performed. Using the same logic, degenerate and non-degenerate SPDC tuning can be achieved for any pump wavelength. It is important to note that for a pump wavelength of 405 nm, the wavelength of the signal and idler photons will not always be exactly 810 nm. It is also allowed that photon pairs can be of differing wavelengths, such as 812 nm and 808 nm, which is known as non-degenerate SPDC. The resulting wavelengths of the signal and idler photons in quasi-phase matched crystals are determined by the pump laser wavelength and the temperature of the crystal. Figure 4.21 shows the temperature dependence of the SPDC photon wavelengths for different pump wavelengths in type-0 crystals while Figure 4.22 shows this dependence for type-II crystals.
The Effect of Crystal Thickness on SPDC in Periodically Poled Crystals
As mentioned previously, longer crystals can provide a higher photon pair generation rate for a given pump power as there is a longer path for the light to interact with the crystal. However, increasing thickness also decreases the spectral phase-matching bandwidth, affecting the range over which quantum photon correlation effects can be observed. Periodically poled crystals are designed to limit group velocity walk-off between the pump, signal, and idler photons, leading to efficient SPDC.
Click to Enlarge
Figure 4.21 In our type-0 PPKTP nonlinear crystals, temperature can be adjusted to accommodate degeneracy with a different pump wavelength or to tune the SPDC away from degeneracy and produce two SPDC photons with different wavelengths.
Click to Enlarge
Figure 4.22 In our type-II PPKTP nonlinear crystals, temperature can be adjusted to accommodate degeneracy with a different pump wavelength or to tune the SPDC away from degeneracy and produce two SPDC photons with different wavelengths.
Thorlabs offers a wide selection of optics optimized for use with femtosecond and picosecond laser pulses. Please see below for more information.
| Low-GDD Mirrors | |||||
|---|---|---|---|---|---|
 |
 |
 |
 |
 |
 |
| 355 - 445 nm | 460 - 590 nm | 700 - 930 nm | 970 - 1150 nm | 1400 - 1700 nm | 1760 - 2250 nm |
| Dielectric Mirror | High-Power Mirrors for Picosecond Lasers |
Metallic Mirrors | Low-GDD Pump-Through Mirrors |
||
|---|---|---|---|---|---|
 |
 |
 |
 |
 |
 |
| Dual-Band Dielectric Mirror, 400 nm and 800 nm |
Ytterbium Laser Line Mirrors, 250 nm - 1080 nm |
Ultrafast-Enhanced Silver Mirrors, 750 - 1000 nm |
Protected Silver Mirrors, 450 nm - 20 µm |
Unprotected Gold Mirrors, 800 nm - 20 µm |
Pump-Through Mirrors, 1030 - 1080 nm and 940 - 980 nm |
| Deterministic GDD Beamsplitters |
Low-GDD Harmonic Beamsplitters |
Low-GDD Polarizing Beamsplitters |
β-BBO Crystals | Dispersion-Compensating Optics | |
|---|---|---|---|---|---|
 |
 |
 |
 |
 |
 |
| Beamsplitters & Windows, 600 - 1500 nm or 1000 - 2000 nm |
Harmonic Beamsplitters, 400 nm and 800 nm or 500 nm and 1000 nm |
High-Power, Broadband, High Extinction Ratio Polarizers, 700 - 1300 nm | β-BBO Crystals for Second Harmonic Generation |
Dispersion-Compensating Mirrors, 650 - 1050 nm |
Dispersion-Compensating Prisms, 700 - 900 nm |
| Posted Comments: | |
| No Comments Posted |

 Zoom
Zoom| Key Specifications for SPDC Applicationsa | ||||
|---|---|---|---|---|
| Item # | NLCK1 | NLCK2 | ||
| Crystal Length | 30.00 mm | |||
| Max Operating Temperature | 120 °C | |||
| Application | Type-0 SPDC | Type-II SPDC | ||
| AR Coating (AOI = 0°) | R < 0.5% at 405 and 810 nm | |||
| AR Coating Curve | Raw Data |
|||
| Pump Wavelength (2ω) | T = 60 °C | 405 nm | ||
| SPDC Signal / Idler Wavelength (1ω) | T = 60 °C | 810 nm | ||
- Mounted Crystal with Antireflection (AR) Coating for 405 nm and 810 nm
- Cut for a 405 nm Pump Wavelength and 810 nm Signal/Idler Wavelength at 60 °C
These PPKTP crystals are designed to produce 810 nm type-0 or type-II SPDC emission from an input beam with a center wavelength of 405 nm. They are designed for degenerate SPDC at 60 °C and can be temperature-controlled by mounting in an NLCH2(/M) nonlinear crystal oven, sold separately below. Tuning the temperature away from 60 °C can accomodate degenerate SPDC with a range of pump laser wavelengths from approximately 404.5 - 406 nm, see the Specs tab for temperature tuning details. These crystals are 30.00 mm long and feature an AR coating to reduce surface reflections at the pump and signal/idler wavelengths. This mounted crystal can be pumped with lasers at 405 nm such as our NPL41B nanosecond pulsed laser, or our L405A1 or DL5146-101S laser diodes.

 Zoom
Zoom| Key Specifications for SPDC Applicationsa | ||||
|---|---|---|---|---|
| Item # | NLCK3 | NLCK4 | ||
| Crystal Length | 30.00 mm | |||
| Max Operating Temperature | 180 °C | |||
| Application | Type-0 SPDC | Type-II SPDC | ||
| AR Coating (AOI = 0°) | R < 0.5% at 775 and 1550 nm | |||
| AR Coating Curve | Raw Data |
|||
| Pump Wavelength (2ω) | T = 60 °C | 775 nm | ||
| SPDC Signal / Idler Wavelength (1ω) | T = 60 °C | 1550 nm | ||
- Mounted Crystal with Antireflection (AR) Coating for 775 nm and 1550 nm
- Cut for a 775 nm Pump Wavelength and 1550 nm Signal/Idler Wavelength at 60 °C
These PPKTP crystals are designed to produce 1550 nm type-0 or type-II SPDC emission from an input beam with a center wavelength of 775 nm. They are designed for degenerate SPDC at 60 °C and can be temperature-controlled by mounting in an NLCH2(/M) nonlinear crystal oven, sold separately below. Tuning the temperature away from 60 °C can accomodate degenerate SPDC with a range of pump laser wavelengths from approximately 774 - 780 nm for Item # NLCK3 or 765 -785 for Item # NLCK4, see the Specs tab for temperature tuning details. These crystals are 30.00 mm long and feature an AR coating to reduce surface reflections at the pump and signal/idler wavelengths. This mounted crystal can be pumped with lasers at around 775 nm such as our DBR780PN distributed Bragg reflector laser or our L780P010 diode laser.

 Zoom
Zoom| Specifications | ||
|---|---|---|
| Item # | NLCH2(/M) | |
| Crystal Length | Up to 30.00 mm | |
| Max Operating Temperature | 200 °C | |
| Clear Aperture | Ø0.18" (4.6 mm)a | |
| Beam Height | 1.00" (25.4 mm) | |
| Operating Voltage | 24 V | |
| Electrical Connection | 6-Pin Female Hiroseb | |
| Dimensions (H x W x D) | 1.87" x 2.51" x 2.50" (47.4 mm x 63.8 mm x 63.5 mm) |
|
| Weight | 0.27 kg | |
| Recommended Controllerc | TC300B | |
- Heating from Ambient Temperature to 200 °C
- Compatible with PPKTP Nonlinear Crystals Above
- Fits Crystals up to 30 mm Long
- Requires a Temperature Controller Such as our TC300B Temperature Controller (Sold Separately Below)
Click to Enlarge
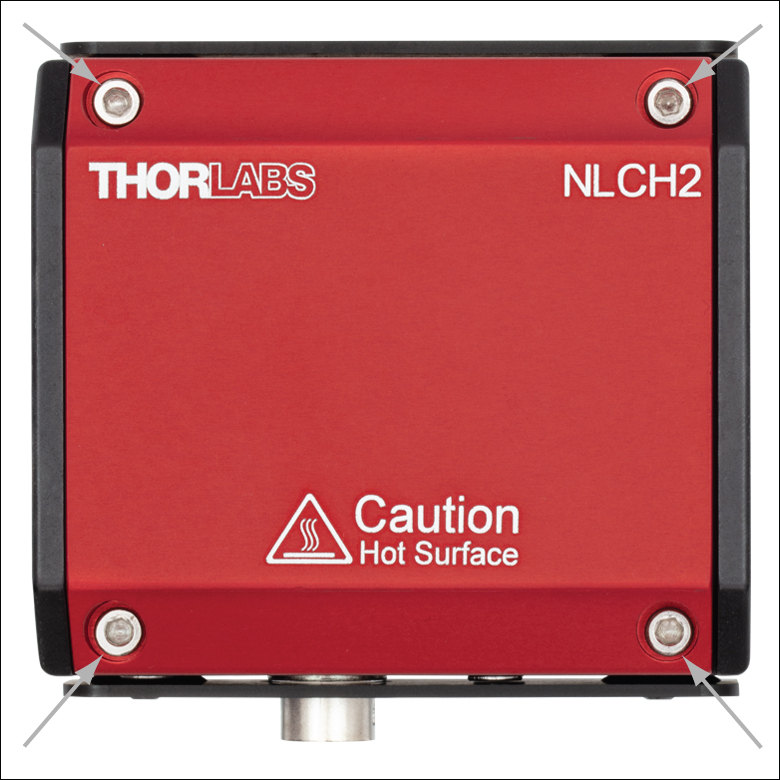
Figure G3.1 Four screws on the top of the oven can be removed to open the cover and access the heater deck.
Click to Enlarge
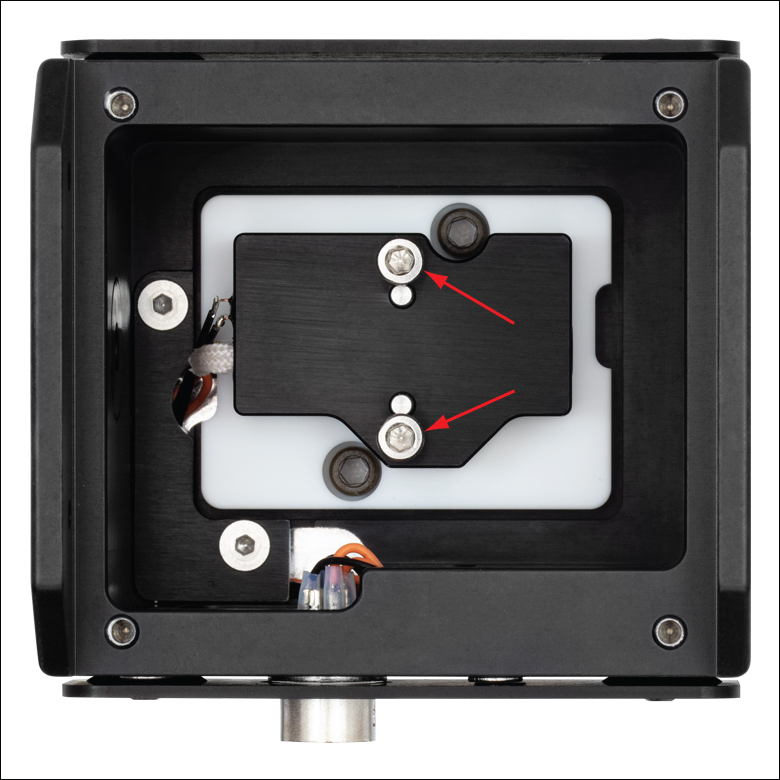
Figure G3.2 Two interior screws can be removed to mount a nonlinear crystal in the ovens.
The NLCLH2(/M) Oven for Nonlinear Crystals is designed to provide temperature control and stability for the nonlinear PPKTP crystals sold above. To mount one of our PPKTP crystals, first remove the cover of the oven via the four M2.5 x 0.45 cap screws shown in Figure G3.1 and the two interior screws shown in Figure G3.2. Then place the crystal in the oven, aligning it with the two Ø2.0 mm dowel pins inside the oven. Finally, secure the crystal using the two cap screws previously removed from the oven's interior.
Each oven features four 4-40 threaded holes on the front and back faces, providing compatibility with our 30 mm Cage Systems for easy incorporation into an optical path. The ovens can be mounted directly to our PY005(/M) 5-Axis Stage via two of the Ø0.13" (3.2 mm) dowel pin holes on the bottom side of the oven (dowel pins not included) and the #8 (M4) central counterbore on the stage. The ovens require a temperature controller, such as our TC300B temperature controller (sold below) and can be connected to the controller using the included 6-pin Hirose cable. For more information on our nonlinear crystal ovens, please see the full web presentation.

 Zoom
Zoom| Key Specificationsa | |
|---|---|
| Output Power per Channel | 48 W (Max) |
| Output Current per Channel | 2 A (Max) |
| Output Voltage per Channel | 24 V (Max) |
| Temperature Setting Range | -200 to 400 °Cb |
| Set Point Resolution | 0.1 °C / 0.001 °Cc |
| Temperature Stability | ±0.1 °C |
| Output Connector Type | Hirose HR10A-7R-6S(73) |
| USB Interface | USB 2.0 Type-B |
| Power Supply | 100 - 240 VAC, 50 - 60 Hz, 165 VA Max |
| Operating Temperature | 0 - 40 °C |
| Storage Temperature | -15 - 65 °C |
| Dimensions (H x W x D) | 86.6 mm x 154.3 mm x 327.8 mm (3.41” x 6.07” x 12.91”) |
| Weight | 1.7 kg |
- Control Temperature from -200 °C to 400 °C
- Run Standalone or via Software
- Programmable PID with Auto-Tuning Functionality
The TC300B Heater and Thermoelectric Cooler (TEC) Temperature Controller is a two-channel benchtop controller intended for use with resistive heating elements and thermoelectric cooler devices rated up to 48 W. It can be used to provide temperature control from ambient to 200 °C for the nonlinear crystal ovens above. User-programmable maximum temperature and current/voltage limits protect the connected heating element from being overheated or over driven. Other safety features include an Open Sensor Alarm that will shut down the driver if the temperature sensing element is missing or becomes disconnected.
Capable of standalone operation from a simple keypad interface, this controller can also be connected to and controlled from a PC using the included USB Type-B cable and our TC300B Software, LabVIEW®* drivers, LabWindows drivers, or a simple command-line interface from any terminal window.
See the full web presentation for more information on the features of the TC300B controller.
*LabVIEW® is a registered trademark of National Instruments Corporation.